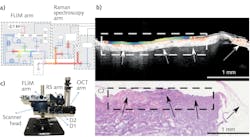
There’s no such thing as a “best” imaging modality. Every image provides partial information, constrained by the details of acquisition. Clinicians must prioritize image modalities, going through a succession of procedures until they can make a diagnosis. Ideally, clinicians could get multimodality information in a single, automatically co-registered acquisition.
Professor Iwan W. Schie of the Leibniz Institute of Photonic Technology (Jena, Germany) and his colleagues are reaching for that ideal. They have developed an instrument that combines optical coherence tomography (OCT), Raman spectroscopy, and fluorescence lifetime imaging (FLIM) in a single multimodal scanning microscope (see figure).1 The instrument is designed to collect information about target tissue conformation and composition to eventually aid in diagnosis.
Combining individual strengths
OCT directs a portion of a beam of infrared light into a material, collects the reflected light, and then recombines it with the remaining portion of the original beam. The resultant interference pattern provides structural information about the sample. In this implementation, the researchers modified an off-the-shelf spectral-domain OCT instrument from Thorlabs (Newton, NJ). The light source emits broadband radiation from 1200 to 1400 nm and spectrally disperses the recombined light. The outgoing and reflected OCT signal beams are sent through a common optical assembly, which introduces dispersion, so the researchers added dispersion-compensating optics to the off-the-shelf module. OCT analysis provides a map of attenuation coefficient (AC) as a function of depth in the target tissue. The AC is the key to correlate OCT data with other information.
Raman spectroscopy is an inelastic scattering process in which an incident photon excites a virtual electronic state in a molecule, but then decays to an excited vibrational state. The resultant emission is shifted by an amount equal to the energy of the vibrational state. In this implementation, a 785 nm laser excitation source is sent through a 800 nm low-pass filter, and the collected Raman signal is reflected off that same dichroic filter into a spectrometer. Raman spectroscopy requires no external fluorescent label, but the signal is about a million times smaller than the incident excitation, or even weaker. The Raman signal from a given molecule will typically contain several different wavelengths, creating a spectral signature that identifies target molecules.
FLIM measurements provide insight into the local environment surrounding a fluorophore. Because the goal here is to provide a tool suitable for minimally invasive, rapid diagnostics, the system is designed to excite and detect autofluorescence, so it’s built to detect the temporal characteristics of four different spectral bands that can differentiate common biological endogenous fluorophores. Building on earlier work from a team led by researchers at the University of California-Davis,2 the system sends 350 ps pulses of 355 nm laser light into the sample. The emitted fluorescence is routed to one of four channels, centered at 390, 452, 542, and 629 nm. The light from each channel is coupled into a dedicated optical fiber, each of which are connected to the input of the same microchannel plate photomultiplier tube. The optical fibers are all of different lengths, so there’s a 58 ns delay between each of the spectral bands. Each single excitation pulse triggers four temporally separated emitted pulses, each of which is digitized to provide an intensity profile. The signals provide both fluorescence intensity and lifetime information, which reflect fluorophore concentration and the fluorophore microenvironment, respectively.
To correlate the information from each modality, it’s essential that the images be co-registered. The coregistration is implemented in a scanning head that incorporates two galvanometer mirrors, a scanning lens, and a CCD imager. One of the galvanometer mirrors is partially silvered, allowing light to pass through directly to the CCD to provide a reference image.
Triple acquisition
Because of the wide wavelength range, the first step in acquisition is adjusting focus for the appropriate wavelength, then capturing a full image. OCT acquisition takes about three minutes to collect a 400 × 400 × 250 pixel image, FLIM about 14 minutes for a 50 × 50 pixel image, and Raman about 41 minutes for a 25 × 25 pixel image.
As a proof-of-principle test, Schie’s team imaged a 5 × 5 cm head and neck tissue biopsy. Three regions of low OCT attenuation coefficient, for example, had distinct FLIM signatures, indicating the structural changes were linked to different tissue composition. The Raman spectra were processed to identify several unique spectral features, which were interpreted as collagen, adipose tissue, and epithelial cells. When correlated with the gold-standard hematoxylin and eosin (H&E) staining, differences in the three combined imaging modalities corresponded to epithelium, necrotic connective tissue, adipose tissue, and tumor epithelium.
The researchers believe this work will “enable a more robust implementation and clinical translation of the OCT/FLIM/RS multimodal system.”
REFERENCES
1. D. Vasquez et al., Anal. Chem., 93, 11479−11487 (2021); doi:10.1021/acs.analchem.1c01637
2. D. R. Yankelevich et al., Rev. Sci. Instrum., 85, 034303 (2014); doi:10.1063/1.4869037.

