Richard Distl and Thomas Nägele
When it comes to measuring light-emitting diodes (LEDs), most people think only of brightness and color. Brightness, however, is not an optical quantity. The appropriate optical quantities to specify depend on both the LED type and the application in which it will be used. In addition, the test-setup arrangement is especially crucial for obtaining results that can be correlated between different laboratories.
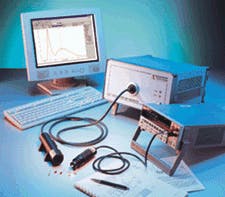
The spectral power distribution of LEDs differs in several aspects from other radiation sources. It is neither monochromatic like a laser nor broadband like a halogen lamp. The spectrum of an LED has a specific peak wavelength (lambdap) and a full-width half maximum (FWHM) of several tens of nanometers. Spectroradiometers are ideal for measuring not only these spectral characteristics, but also radiometric and photometric quantities of LEDs. Spectroradiometers record the radiation spectrum of an LED and from this calculate the desired parameters, such as dominant wavelength and luminous intensity (see Fig. 1).
Traditional photometers are significantly flawed when testing blue, red, and white LEDs. Photometers are optimized for performing measurements on broadband radiation sources such as halogen lamps. However, the correction of the detector (using a filter) to the spectral sensitivity function of the eye—the V-Lambda function—is always poor at the ends of the visible spectral range. Spectroradiometers avoid this problem because the exact V-Lambda curve is stored in the software and used for processing the data from the measured spectrum of the LED.
Luminous intensity
Luminous intensity (the radiometric equivalent is radiant intensity) is the most frequently measured parameter of LEDs. The underlying concept for measuring luminous intensity assumes a point source of light. One method of determining luminous intensity Iv involves calibrating a detector in illuminance Ev and calculating luminous intensity using the inverse square law Iv = Ev r2 (where r is the distance between the LED and the detector). However, the validity of this calculation requires two conditions. First, the distance r must be precisely determined—the many different LED designs available make it difficult to determine the precise position of the emission center of the LED. Second, the distance r must be large with respect to the spatial width of the light source, which is the far-field condition.
Many LEDs have a relatively large emitting area compared to the short distance that is generally used for a measurement, and hence the point-source assumption is not valid. Therefore, the inverse square law no longer holds, and the illuminance measured at the detector is not directly related to the luminous intensity of the source.
The International Commission on Illumination (CIE; Vienna, Austria) has developed the concept of "averaged LED intensity" to solve the problem that occurs under near-field conditions. This concept no longer corresponds to the physically precise definition of luminous intensity but relates more to a measurement of partial luminous flux at a fixed distance. The LED is positioned in such a way that its mechanical axis is directly in line with the center point of a round detector with an active area of 1 cm2.
The CIE provides recommendations for the distance between the LED and the detector surface (see Fig. 2). The front tip of the LED is taken as the reference point for the distance in both cases. This guarantees that the same geometry is always used when measuring luminous intensity in different laboratories, regardless of the design of the LED package.Spatial radiation characteristics
Different package designs and LED types generate different spatial radiation patterns. Precise knowledge of the angle-dependent distribution of radiation is necessary for a variety of applications. For example, a full-color (red, green, blue) LED display may appear white when observed at a normal angle if all three colors are illuminated simultaneously. However, if the LEDs have a different spatial distribution of radiation for the individual colors, a color change occurs when the display is observed off-axis.
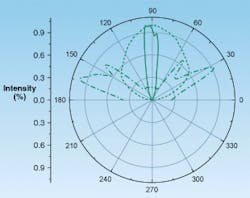
A goniophotometer can analyze the radiation pattern of an LED. The LED is pivoted about its tip and the intensity is measured. That is, the angle theta is scanned, providing a profile of the radiated beam in one plane (see Fig. 3). To record a two-dimensional radiation pattern the LED can also be rotated about its mechanical axis. This corresponds to angle phi in the spherical coordinate system. The detector of the goniophotometer should be positioned at a distance of 10 to 20 cm for measuring Lambertian radiation distributions. If a high-angle resolution is required to determine the structure of very narrow angled LEDs, the detector should instead be positioned at a distance of 30 to 50 cm with an aperture limit at the detector. Angular scanning requires increments of 0.1° (for typical narrow-angled LEDs with FWHM of 2°.The combination of a goniophotometer with a spectroradiometer enables measurement of angle-dependent spectral properties of LEDs. In this case, the detector comprises a diffuser and a fiber bundle connected to a spectroradiometer. The advantage of a goniospectroradiometer is that all relevant information, such as the photometric integral, color coordinates, dominant wavelength, and color temperature, can be recorded simultaneously with each measurement.
Luminous flux
The two principal methods for measuring luminous flux (the radiometric equivalent is total radiant power) involve either an integrating sphere or a goniophotometer. The integrating sphere is a hollow sphere, the interior of which is coated with a diffuse reflecting material. The sphere must have a port for the LED and a baffled port for the detector. The theory of an integrating sphere is based on ideal assumptions. There are, however, several sources of error under experimental conditions. It is impossible, for example, to create a perfectly diffuse reflector with constant reflectance over the entire interior of the sphere. Spectral characteristics of the coating and the size of the ports also constitute additional sources of error.
The wide range of radiation characteristics shown by LEDs can result in calibration problems when measuring luminous flux. An accuracy of ±5% can be obtained for components with diffuse emission, but deviations of more than 10% are possible with narrow-angled LEDs. Sphere diameters of 80 and 150 mm have become established for measuring luminous flux. The larger sphere is recommended if it is important to keep measurement errors to a minimum, because the ratio of the sphere area to the size of the ports and the LED is more favorable. However, this advantage results in a loss of intensity.
The question of where to position the LED in the integrating sphere still remains a matter of controversy. In the latest CIE discussions it was suggested that the entire package of the LED be positioned inside the sphere up to the point where the contacts start. This setup is called 2pi luminous flux measurement, allowing the best match to the actual use of the LED in a product (for example, in a backlight).
The goniophotometer
A goniophotometer offers another method for determining luminous flux and total radiant power. Picture the LED enclosed by an imaginary sphere. A cosine-corrected detector moves on the surface of the sphere along specific paths at distance r (in this case, the sphere radius). The detector is used to determine irradiance E arising as a result of the partial radiant flux dphi incident on detector area dA as a function of angles theta and phi:
In order to determine total radiant power, the detector is moved incrementally around angle theta. Several measurements are taken for each angle thata with angle phi varying from 0° to 360°. Individual zones are scanned corresponding to a constant degree of latitude of the sphere. Total radiant power F is then
Alternatively, instead of moving the detector, which requires considerable mechanical effort, the LED can be rotated about its tip. This setup is used in the LED goniophotometer from Instrument Systems. The distance between the LED and detector is typically 30 cm. A measurement area of 1 cm2 is recommended for diffuse LEDs; however, this active area should be reduced for narrow-angled LEDs.
Making accurate LED measurements
Several conditions must be met for performing light measurements on LEDs. It is possible to obtain results that are repeatable and that can be correlated between different laboratories only when using defined measurement geometries as recommended by the CIE. Otherwise, LEDs having the same luminous intensity but different spatial radiation patterns will deliver different results when intensity is measured in the traditional way. This is especially critical for modern high-brightness LEDs with a narrow emission angle.
Accuracy mainly depends on the spectroradiometer used and the associated calibration procedure. Only high-performance spectroradiometers with an optical and electronic dynamic range of 3 to 4 orders (minimum) and a spectral resolution better than 5 nm are suitable for carrying out precise measurements on LEDs. Low dynamic range results in significant errors, particularly when measuring blue, deep red, and white LEDs. The calibration must be traceable to a national calibration laboratory and be based on a two-step procedure using a tungsten halogen lamp for spectral response and an LED standard for the absolute calibration. Traditional photometers are not recommended for LED measurements because of an inadequate correction of the detector to the sensitivity curve of the human eye (the V-Lambda function) in the blue and red regions.
RICHARD DISTL is founder and president and THOMAS NÄGELE is an applications engineer at Instrument Systems GmbH, Neumarkter Strasse 83, 81673 Munich, Germany; e-mail: [email protected].


